For years, home brewers relied on glass hydrometers—fragile, temperature-sensitive, and prone to parallax errors. A single misreading could derail fermentation calculations, skew ABV estimates, or mask stalled fermentations until it was too late. The digital hydrometer changed that. Not as a gimmick, but as a precision tool: calibrated, responsive, and built for the realities of small-batch brewing. When used correctly, it delivers repeatability no glass tube can match—not because it’s “faster,” but because it removes human variables from one of brewing’s most consequential measurements: specific gravity.
This isn’t about swapping tools for novelty. It’s about understanding how digital hydrometers convert density into actionable data—and how that data, when interpreted with context, becomes the foundation for consistency across batches, seasons, and recipes.
Why Digital Hydrometers Outperform Traditional Tools in Real Brewing Conditions
Traditional glass hydrometers require 50–100 mL of wort or beer, must be spun to dislodge bubbles, read at eye level (often while balancing over a carboy), and corrected for temperature using charts or apps. Even experienced brewers routinely see ±0.002 SG variance between readings—enough to misjudge final attenuation by 3–5% or miscalculate ABV by 0.3–0.5%. In practice, that means confusing healthy diacetyl rest with stuck fermentation—or worse, bottling under-attenuated beer.
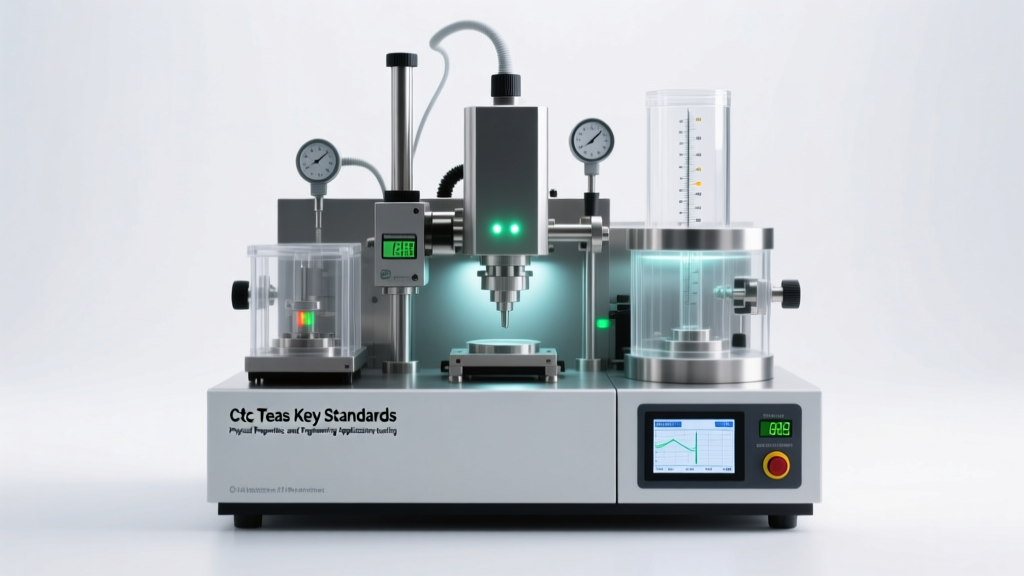
Digital hydrometers, particularly refractometer-based or oscillating U-tube models designed for brewing (e.g., VinoMeter Pro, Anton Paar DMA 35, or the more accessible iBrew Digital Hydrometer), measure density electronically. Refractometers calculate Brix (sugar concentration) via light refraction; oscillating U-tube devices vibrate a sample-filled capillary and derive density from resonant frequency shifts. Both eliminate visual interpretation, reduce sample volume to 0.2–2 mL, and auto-correct for temperature within ±0.1°C. Crucially, they provide immediate, stable readings—even when sampling directly from a fermenting vessel at 20°C ambient and 18°C beer temp.
The real advantage emerges not in isolation, but in pattern recognition. Tracking gravity every 12 hours during active fermentation reveals subtle inflection points: the moment CO₂ production peaks, the first sign of deceleration, or the plateau indicating completion. Glass hydrometers rarely support this cadence. Digital tools do—without risking contamination or oxidation from repeated sampling.
Step-by-Step: Calibrating and Using Your Digital Hydrometer Correctly
Calibration isn’t optional—it’s the baseline for all subsequent accuracy. Skipping it guarantees drift. Follow this sequence precisely:
- Prepare calibration solution: Use distilled water at 20°C (68°F). Do not use tap or filtered water—minerals affect density. Chill or warm water in a sealed container until stabilized at target temp (verify with a calibrated thermometer).
- Power on and stabilize: Turn on the device 5 minutes before calibration. Let internal sensors acclimate to room temperature.
- Load sample: Using a clean, lint-free pipette, draw 0.5–1 mL of distilled water. Dispense gently onto the measurement surface (refractometer) or into the sample chamber (U-tube). Avoid bubbles or streaks.
- Initiate calibration: Press the CAL button (or follow device-specific prompt). Wait for confirmation tone or screen message. Do not disturb the unit during calibration—vibration affects resonance.
- Verify with known standard: After calibration, test with a 10.0°Bx sucrose solution (commercially available or prepared gravimetrically). Reading must fall within ±0.1°Bx. If not, recalibrate or consult manufacturer specs for tolerance limits.
- Sample wort/beer: For pre-fermentation readings, cool wort to 20°C and filter through cheesecloth to remove hop debris. For fermenting samples, withdraw via sanitized wine thief, chill to 20°C, and centrifuge or let solids settle 2 minutes before sampling the clear supernatant.
Interpreting Readings: Beyond the Number on Screen
A digital hydrometer gives you a number—but brewing decisions depend on what that number means *in context*. Consider this scenario: Your original gravity reads 1.058. After 48 hours, it drops to 1.022. That 36-point drop looks promising—until you realize your yeast strain typically attenuates 78–82%, meaning expected final gravity is 1.011–1.013. A reading of 1.022 suggests incomplete fermentation or sluggish yeast health.
Here’s how to translate readings into action:
- Calculate apparent attenuation: [(OG – FG) ÷ OG] × 100. Compare against strain specifications (e.g., US-05: 73–77%; WLP007: 70–75%). Consistently low attenuation signals need for oxygenation, nutrient addition, or temperature adjustment.
- Estimate ABV accurately: Use the formula: (OG – FG) × 131.25. Digital precision matters here—0.002 error in FG changes ABV by 0.26% in a 6% beer.
- Track fermentation velocity: Plot gravity vs. time. Healthy ale fermentation often drops 5–10 points in the first 24 hours, then slows. A flatline after 36 hours warrants investigation—check temperature, rouse yeast, or verify viability.
- Detect infection early: Unexplained gravity rise after apparent completion (e.g., 1.010 → 1.013) may indicate wild yeast consuming dextrins or bacteria producing CO₂ and acids.
| Reading Scenario | Most Likely Cause | Action Required |
|---|---|---|
| OG consistently 0.003–0.005 lower than predicted | Incomplete mash conversion or sparge inefficiency | Check mash pH (5.2–5.6), crush fineness, and sparge temperature (76–78°C) |
| FG higher than expected despite healthy fermentation signs | High unfermentables (e.g., excessive crystal malt, oats, lactose) | Review recipe fermentability; consider enzyme additions (amyloglucosidase) next batch |
| Gravity unchanged for >72 hours at correct temp | Yeast stress (low O₂, high ethanol, nutrient depletion) | Measure dissolved O₂ (if possible); add yeast nutrient; gently rouse sediment |
| Post-fermentation reading fluctuates ��0.002 between tests | Temperature instability during sampling or insufficient settling | Chill sample to 20°C for 5 min; centrifuge if available; retest |
Real-World Application: How One Brewer Solved Chronic Inconsistency
Maya Rodriguez brewed award-winning stouts for three years—yet her IPA batches varied wildly in bitterness and finish. Her OG readings were consistent, but FG ranged from 1.010 to 1.018 across identical recipes. She assumed it was yeast lot variation—until she borrowed a calibrated digital hydrometer.
Her first discovery: her glass hydrometer read 1.058 for wort her digital unit measured at 1.061. That 3-point difference explained why she’d been under-predicting attenuation. But the real insight came from hourly readings during fermentation. She noticed her IPA consistently stalled at 1.016 after 48 hours—then dropped sharply to 1.011 between hours 60–66. Temperature logs showed her ferm chamber dipped 2°C overnight due to a faulty sensor.
She upgraded her controller, added a secondary heater, and began taking readings at hour 54 instead of waiting for the 72-hour mark. Final gravity tightened to 1.010–1.012. IBUs became predictable. Clarity improved. Her next IPA won Best in Show at the Pacific Northwest Homebrew Competition. As she told Brewing Techniques: “I didn’t change my process—I just stopped guessing where fermentation actually stood.”
“Digital hydrometers don’t make better beer. They reveal what’s already happening—so you can intervene with precision, not hope.” — Dr. Alan Torres, Fermentation Scientist, Siebel Institute of Technology
Common Pitfalls and How to Avoid Them
Digital tools introduce new failure modes. Understanding them prevents false confidence:
- Residue buildup: Wort proteins, hop oils, and ethanol leave films on optical surfaces or clog micro-chambers. Clean immediately after each use with isopropyl alcohol (90%+) and a microfiber cloth. Never use abrasive cleaners or paper towels.
- Temperature lag: Chilling a 200 mL sample in an ice bath takes 5+ minutes. During that time, evaporation concentrates sugars, raising Brix artificially. Always chill samples in sealed containers and equilibrate to 20°C before opening.
- Alcohol interference (refractometers only): Standard refractometers assume pure sucrose solutions. Ethanol bends light differently, causing false-high readings in post-fermentation samples. Use a correction calculator (e.g., Sean Terrill’s online tool) or switch to a dual-wavelength refractometer designed for fermented beverages.
- Over-reliance on single readings: Gravity is dynamic. A single FG reading confirms nothing. Always take two readings 12 hours apart. True completion requires stability within ±0.001 for 24 hours.
FAQ
Can I use a digital kitchen scale instead of a hydrometer?
No. Scales measure mass, not density. Specific gravity is the ratio of liquid density to water density at a defined temperature. You cannot derive SG from weight alone without knowing exact volume and temperature—introducing far more error than a properly used digital hydrometer.
Do I still need a thermometer if my hydrometer has temperature compensation?
Yes. Compensation algorithms assume uniform sample temperature. If your wort is 22°C but the probe tip reads 20°C due to poor contact, compensation fails. Always verify sample temperature independently with a calibrated digital thermometer.
How often should I recalibrate?
Before every brewing session. Also recalibrate if ambient temperature shifts >5°C, after dropping the device, or if readings diverge from known standards by >0.001 SG. Keep a log: date, calibration result, and any corrective action taken.
Conclusion
Accuracy in home brewing isn’t about perfection—it’s about eliminating avoidable noise so your instincts and experience can operate on reliable data. A digital hydrometer doesn’t replace judgment; it sharpens it. When you know your original gravity is truly 1.064—not 1.061 or 1.067—you can adjust hopping rates with confidence. When you see fermentation stall at 1.014—not “somewhere around 1.015”—you diagnose before off-flavors develop. Consistency isn’t born from rigid recipes alone. It’s forged in the quiet moments between readings, where data replaces doubt.
Your next batch is the ideal time to start. Calibrate today. Take three readings—at 0, 24, and 48 hours—and compare them to your glass hydrometer. Note where they diverge. Then ask: what decision would I have made differently with that extra precision? The answer is your first step toward repeatable excellence.
💬 Share your digital hydrometer breakthroughs, calibration tips, or fermentation insights below. Help fellow brewers turn data into delicious, dependable beer.