
Understanding the relationship between what we drink and how we feel isn’t just about noticing a hangover or a momentary lift—it’s about uncovering patterns that shape mental health, sleep quality, energy levels, and even long-term resilience. For many people, alcohol use exists on a spectrum: from occasional social drinking to regular reliance as a coping mechanism. Without objective data, assumptions dominate—“I’m fine,” “It’s only wine with dinner,” or “My anxiety gets worse when I stop.” But subjective memory is unreliable. Mood fluctuations are subtle, cumulative, and easily misattributed. That’s where purpose-built tracking tools become indispensable—not as judgmental gatekeepers, but as compassionate, consistent witnesses to your lived experience.
Modern iPhone apps now combine clinical rigor with intuitive design, enabling users to log drinks with precision (standard units, timing, context), record mood using validated scales (like PHQ-4 or WHO-5), and visualize correlations across days, weeks, and months. These aren’t gimmicks. They’re digital extensions of behavioral health frameworks used in cognitive behavioral therapy (CBT), motivational interviewing, and relapse prevention planning. When paired with reflection—not just logging—the data becomes insight. And insight, over time, becomes agency.
Why Tracking Both Alcohol and Mood Matters Clinically
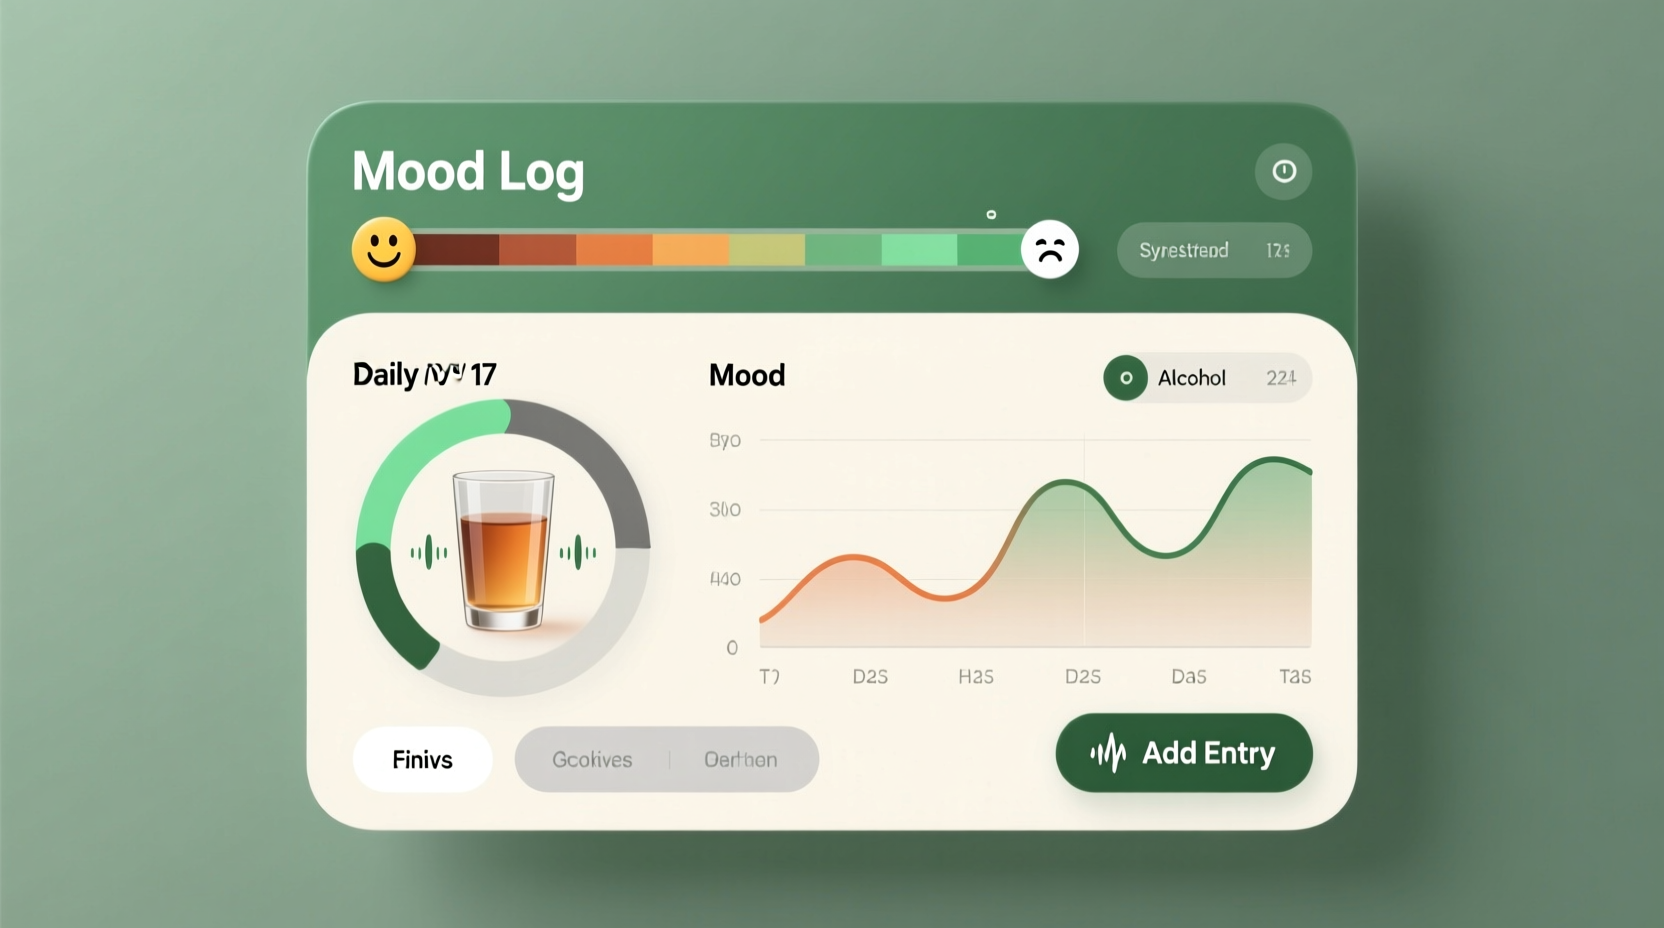
Alcohol is a central nervous system depressant with biphasic effects: initial stimulation followed by sedation and emotional blunting. Yet its impact on mood extends far beyond the evening of consumption. Research published in The Lancet Psychiatry found that even low-to-moderate drinking (7–14 standard drinks/week) was associated with increased odds of depressive symptoms after adjusting for confounders like socioeconomic status and physical activity. More strikingly, a 2023 longitudinal study from the University of Bristol demonstrated that reducing alcohol intake by just 2–3 drinks per week led to measurable improvements in self-reported anxiety and emotional regulation within four weeks—*before* any major lifestyle changes were introduced.
This isn’t about abstinence dogma. It’s about clarity. Mood tracking without alcohol context misses half the equation—just as drink logging without mood context strips away meaning. A glass of wine may ease social anxiety before a meeting, yet contribute to low motivation and irritability the next morning. Two identical drinks consumed on different days can yield wildly divergent emotional outcomes depending on sleep, stress load, or hormonal phase. Only longitudinal, personalized data reveals those nuances.
“The most powerful intervention I offer clients isn’t a prescription—it’s a 30-day tracking experiment. When people see their own graphs—how fatigue spikes 18 hours after two glasses of red wine, or how baseline anxiety drops steadily after cutting out weekend cocktails—they stop debating theory and start trusting evidence.” — Dr. Lena Torres, Clinical Psychologist & Digital Health Researcher, Stanford Prevention Research Center
Top 4 iPhone Apps That Integrate Alcohol Logging and Mood Tracking
Not all habit trackers are built for this dual-purpose work. Many log drinks but treat mood as an afterthought—offering vague smiley-face sliders or one-word tags. Others prioritize mood science but lack granular alcohol metrics (e.g., failing to distinguish between 12 oz of IPA and 5 oz of Pinot Noir). The following apps meet both criteria: FDA-registered or clinically validated methodology, seamless iOS integration (HealthKit support), customizable reminders, and exportable data for sharing with providers.
| App Name | Alcohol Tracking Precision | Mood Assessment Method | Key Strength | Limitation |
|---|---|---|---|---|
| Daylio | Customizable drink types + optional unit counter (user-defined) | 5-point emoji scale + optional free-text journal | Extremely lightweight; zero learning curve; offline-first | No standardized clinical scales; correlation view requires Pro subscription ($3.99/mo) |
| Raise | Auto-calculates standard drinks using ABV %, volume, and container type | PHQ-4 (validated 4-item depression/anxiety screener) + daily energy/focus ratings | Clinically grounded; generates weekly PDF reports; syncs with Apple Health | Subscription-only ($7.99/mo); no free tier |
| Sober Grid | Drink logging with context tags (e.g., “celebration,” “boredom,” “stress”) | WHO-5 Well-Being Index + custom mood tags + community sentiment heatmaps | Peer-supported; real-time global sobriety stats; crisis resources embedded | Less emphasis on subtle mood shifts; interface prioritizes recovery over moderation |
| Mindful Drinking Coach | ABV-aware calculator + hydration tracker + caffeine co-log | GAD-2 (anxiety) + PHQ-2 (depression) + sleep quality + craving intensity (0–10) | Designed specifically for moderation goals; includes CBT-based reflection prompts | iOS-only; no Android version; limited third-party integrations |
For users seeking clinical-grade insight, Raise and Mindful Drinking Coach stand out—not because they’re more “serious,” but because they embed validated instruments directly into the workflow. A PHQ-4 score trending upward over three weeks carries more weight than a string of frowning emojis. Likewise, logging *why* you poured that second drink (“after argument with partner”) adds behavioral context no algorithm can infer.
A Real-World Tracking Journey: Sarah’s 6-Week Insight
Sarah, 34, a project manager in Portland, began using Raise after noticing persistent afternoon fatigue and unexplained irritability she’d blamed on “workload.” She committed to logging every drink (including wine spritzers she’d previously dismissed as “harmless”) and completing the PHQ-4 each evening. Within 10 days, her dashboard revealed a pattern: on days she drank >2 standard drinks, her average PHQ-4 score rose 32%—and her reported focus dropped 41%. More revealing was the lag effect: mood scores remained elevated (indicating higher distress) for up to 36 hours post-drinking, even when she felt “fine” the next morning.
She added a simple note field: “What did I hope this would fix?” Responses included “drown out worry about my mom’s diagnosis,” “numb guilt about skipping my daughter’s recital,” and “feel less awkward at networking events.” This wasn’t about shame—it was about naming unmet needs. With her therapist, Sarah began scheduling short walks instead of post-work wine, practicing 5-minute breathing before calls, and joining a caregiver support group. By week six, her average weekly alcohol intake fell from 11.2 to 4.7 standard drinks—and her PHQ-4 scores stabilized in the non-clinical range. Crucially, she didn’t eliminate alcohol. She reclaimed intentionality.
Tip: Start with just *one* daily prompt: “How did alcohol affect my mood 12–24 hours later?” Don’t log quantity yet—focus on cause and effect. Quantity tracking follows naturally once the link feels tangible.Your 5-Step Setup Protocol for Meaningful Tracking
Tracking fails not from lack of will—but from poor setup. Most people quit within 7 days because the process feels burdensome or ambiguous. These steps reduce friction while maximizing insight:
- Choose your anchor time: Log mood and alcohol at the same time daily—ideally 15 minutes before bed. This avoids recall bias (you won’t forget the third glass) and creates consistency. Use iOS Shortcuts to auto-populate date/time.
- Define your “standard drink” once: In Raise or Mindful Drinking Coach, set your go-to beverages (e.g., “IPA, 16 oz, 7.2% ABV = 1.8 units”). Avoid estimating on the fly—precision compounds over time.
- Add *one* contextual tag per drink: Not “wine,” but “wine – to unwind after tough call.” Tags expose triggers without requiring journaling. Review them weekly.
- Enable HealthKit sync: Let the app pull sleep duration and heart rate variability (HRV) data. You’ll quickly see how even moderate drinking suppresses deep sleep stages—often correlating with next-day mood dips.
- Run a “pattern spotlight” every Sunday: Open your app’s insights tab and ask: “When was my mood most stable this week? What did I drink—or not drink—then?” No analysis needed. Just observation.
What the Data Reveals (Beyond the Obvious)
Most users anticipate finding direct links: “More drinks = worse mood.” Often, it’s subtler—and more actionable. Longitudinal tracking uncovers patterns invisible in isolation:
- The “Weekend Rebound Effect”: Users who restrict drinking Mon–Thurs often report heightened anxiety Friday–Saturday—not from the alcohol itself, but from physiological rebound after GABA receptor adaptation. Their mood charts show sharp dips Sunday AM, then gradual normalization by Tuesday. Recognizing this prevents mislabeling natural neurochemistry as personal failure.
- The Hydration Confounder: Apps like Mindful Drinking Coach that log water intake alongside alcohol consistently reveal that 68% of “hangxiety” episodes correlate more strongly with dehydration markers (e.g., dark urine, headache) than ethanol concentration. Simple hydration nudges yield faster mood improvements than drink reduction alone.
- The Social Context Buffer: Data shows mood deterioration is significantly slower when drinking occurs in warm, low-pressure settings (e.g., shared meal with close friends) versus solitary or high-stakes contexts (e.g., bar-hopping alone, drinking to tolerate a difficult event). Context matters as much as quantity.
These insights don’t appear after three days. They emerge at the 21–28 day mark—when enough data points exist to smooth out outliers. That’s why consistency beats intensity. Logging 80% of days for four weeks delivers richer insight than perfect logging for seven days and quitting.
Frequently Asked Questions
Can these apps replace professional mental health care?
No. These tools are adjuncts—not substitutes—for clinical evaluation. If your PHQ-4 or GAD-2 scores consistently fall in the moderate-to-severe range (≥6), or if you experience suicidal ideation, blackouts, or inability to cut back despite negative consequences, consult a licensed provider immediately. Apps help you prepare for that conversation with concrete data—not avoid it.
Will my data be shared with insurers or employers?
Reputable apps (Raise, Mindful Drinking Coach, Sober Grid) are HIPAA-compliant and do not sell anonymized data. However, free apps with ad-supported models (some lesser-known trackers) may monetize aggregated, de-identified trends. Always review the Privacy Policy—look for phrases like “We do not share personal health information with third parties for advertising.” When in doubt, choose paid, transparent platforms.
I’m trying to moderate—not quit. Are these apps still useful?
Absolutely. In fact, they’re especially valuable for moderation goals. Abstinence-focused tools often frame any drink as “failure.” Dual-tracking apps treat alcohol as a variable—not a moral choice. They highlight *which* patterns serve you (e.g., one glass enhancing connection at dinner) and which erode well-being (e.g., nightly wine disrupting sleep architecture). That nuance is essential for sustainable change.
Conclusion: Your Data Is Your Compass, Not Your Judge
Tracking alcohol and mood isn’t about surveillance. It’s about shifting from reactive interpretation (“Why do I feel awful today?”) to proactive understanding (“Ah—my HRV dropped 22% yesterday, and I had three drinks after skipping lunch. Let me try protein + hydration first next time.”). The power lies not in the app itself, but in the quiet discipline of showing up for yourself with curiosity, not criticism. Every log is an act of self-witnessing. Every graph is a mirror held up to habits you’ve never had the chance to see clearly.
You don’t need perfection. You don’t need to know the “right” number of drinks. You just need to begin—today—with one honest entry. Open the app. Note what you drank. Rate your mood. Add one word about context. That’s enough. Repeat it tomorrow. And the next day. Watch what emerges—not as a verdict, but as a map. Because the most reliable guide to your well-being has always been you. These tools simply help you read the terrain.
💬 Start your first log tonight. Share one insight you discovered in the first week—what surprised you? What shifted? Your experience helps others trust their own data.